Hi Revnart and others
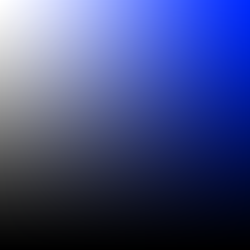
Using your test image and using the HSB and HSL filters to pull out the Saturation for each (in the Green Channel) - I do get the exact same results as you.
The pixelated look are not actually artifacts or anomalies yet solely due to the math involved and quantization effects. In those areas there are small value pixels (with only 8 bit resolution) being divided also by small pixel values (also of 8 bit resolution). Makes a pretty design.
If the image were in 16 bit mode and the gradients were also 16 bit resolution gradients when built, you would most likely not see this issue so prominently. Not too different from extreme adjustments of 8 bit images causing banding issues.
However, interpretation of the different Saturation models has always been a challenge for me yet I have some examples below that might help explain some of the differences and also show why when creating a Saturation mask, one may be better than others.
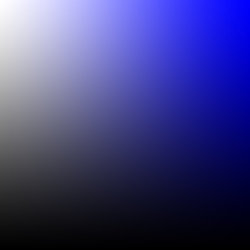
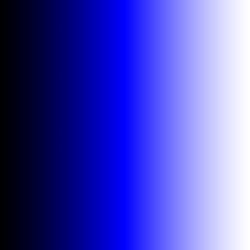
The base image I am going to use has a Hue of pure Blue and horizontally increasing the Blue channel from the black left area to maximum Blue in the middle (R=0, G=0, B=255) and then from the middle to the right increasing Red and Green channels linearly until you to full white on the right:
Repeating the math from a prior post for reference
Cmax = Max (R,G,B)
Cmin = Min (R,G,B)
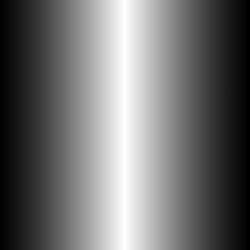
Saturation (as used in the Saturation Blend and Revnarts Lookup Table) is:
SATsat = Cmax-Cmin
The grayscale image of this version of Saturation follows:
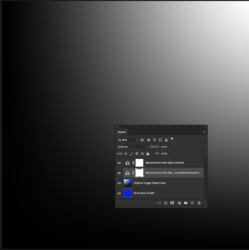
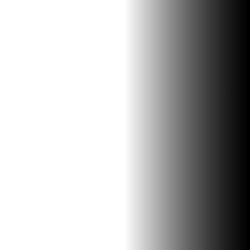
Now the Saturation model from HSB model has slight different math. I won't give the math yet it starts the same as Cmax-Cmin as before yet is uplifted by dividing by Cmax. Cmax is the same as the B or brightness level in the HSB model.
So applying this to the base image above, you will see pure white on the left because the heavy uplifting for dark areas on the image yet on the right, Cmax is the same while Cmax-Cmin is decreasing.
So you see a decrease in Satuartion in light areas This does not match my intuition for saturation overall yet that is how the HSB model works:
The HSL model for Saturation (SAThsl) is another level of difference. You start with the same Saturation amount of Cmax-Cmin or SATsat and it is uplifted both for lower and higher luminosity portions of the image. It effectively is displaying how the Saturation numbers relative to luminosity.
So when using the HSL version of Saturation using the HSL Photoshop filter to the same base image above, you end up with pure white over the full image. This too does not match my intuition for a Saturation mask (NOTE: I added a border so you could see it:

This was not a deep dive into the different models yet hopefully enough to show how they display differently. The example I contrived was to show the extreme difference among the models and why you might want to choose the first version vs the HSB or HSB versions of Saturation. Just my opinion of course.
Sorry if I lost you on the way, sometimes I am so left brained my head hangs over that way and makes me walk with a limp


