What's new
Photoshop Gurus Forum

Welcome to Photoshop Gurus forum. Register a free account today to become a member! It's completely free. Once signed in, you'll enjoy an ad-free experience and be able to participate on this site by adding your own topics and posts, as well as connect with other members through your own private inbox!

Cropping a complicated image from a complicated background?


Messages
12
Likes
1
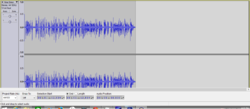
Good afternoon everyone!For the past few days, i've been trying to cut away a peice of audio from a screenshot of my music program.Here's an example:
firsttrack000.png
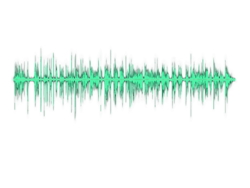
I'm essentially trying to get this:(my first initial "crop-out")Nina-Simone---Blackness.pngI wanted to know if there was a cleaner, more efficient way I could remove the audio track from the screenshot? This one's a bit sloppy and the quality isn't so nice.The problem is, this cropout of the audio is going to be going on a t-shirt. I'm afraid the shirt's overall design will suffer if I continue the method i've been doing. I've used the lasso tool around one of the tracks, and toggled with the options in "Refine Edge..." until I came out with the image directly above ^.I'm not new to Photoshop but i'm far from an expert.ANY help or suggestions will be GREATLY appreciated! Thank you!!
 
Hi Southern
Welcome to the forum.
Is the design going to be screenprinted on the shirt?

A good way to do this is to use Advanced Blending. Simply open your image, duplicate the layer (Ctrl/Cmd J) .Hide the background layer, Then double click in the new layer and this screen will pop up. Slide the indicated slider to the left and all the white will disappear.
extract scrn.PNG
If this is to be screenprinted, all of the green would be extracted as a gray scale alpha channel as a separation. But that would be handled by the printing company or separator.

I'm curious though..where is the COMPLICATED background? Am I missing something?
 
Last edited:
Hi Southern
Welcome to the forum.
Is the design going to be screenprinted on the shirt?

A good way to do this is to use Advanced Blending. Simply open your image, duplicate the layer (Ctrl/Cmd J) .Hide the background layer, Then double click in the new layer and this screen will pop up. Slide the indicated slider to the left and all the white will disappear.
View attachment 51797
If this is to be screenprinted, all of the green would be extracted as a gray scale alpha channel as a separation. But that would be handled by the printing company or separator.

I'm curious though..where is the COMPLICATED background? Am I missing something?


Yes it will be screenprinted.

And as for the "complicated background" I was actually referring to the first picture. Sorry for the confusion.
firsttrack000.png
 
The gray in that one can be removed the same way..same slider.Does that help you?
track blue.PNG
 
Hey, SouthernA, welcome to PSG.

The problem with working from the screen shot images that you posted is that their resolution is quite low, 626 x 285 pixels, and since there are vertical lines in the display that appear to be only 1 pixel wide, so I'm worried that after extraction and printing, the result will look pretty amateurish.

To be honest, if it was me, I would use a completely different program, Matlab, that could produce the same graph, except at much higher resolution, and with any background color you want. If you don't have access to Matlab, there is a free version called, "Octave" that you could use. If you don't want to go that route, I'm sure there are many other audio waveform viewing programs available that could produce better output than the screenshot that you posted.

HTH,

Tom M
 
Last edited:
This is about the best I could do. I first used Photo Zoom 5 to up-rez it by 3x in each dimension. Then I used the color range tool to extract out the blue. Finally, for fun, I put several different backgrounds behind the extracted waveform. Note: The PNG labeled, "transparent bkgnd" will show as a white background when displayed in this forum, but if you download the file, the background will indeed be transparent, as you requested.

If the quality of these is not good enough, I think you won't have much choice except to use a different program to generate the waveform at higher resolution.

HTH,

Tom M
 

Attachments

  • audio_waveform-tjm01-acr0-zoom-ps01a_sRGB-01_transparent_bkgnd.png
    audio_waveform-tjm01-acr0-zoom-ps01a_sRGB-01_transparent_bkgnd.png
    6.1 MB · Views: 8
  • audio_waveform-tjm01-acr0-zoom-ps01a_sRGB-04_bw_bkgnd.png
    audio_waveform-tjm01-acr0-zoom-ps01a_sRGB-04_bw_bkgnd.png
    6.1 MB · Views: 1
  • audio_waveform-tjm01-acr0-zoom-ps01a_sRGB-02_vert_color_bands.png
    audio_waveform-tjm01-acr0-zoom-ps01a_sRGB-02_vert_color_bands.png
    6.1 MB · Views: 1
  • audio_waveform-tjm01-acr0-zoom-ps01a_sRGB-03_complex_bkgnd.png
    audio_waveform-tjm01-acr0-zoom-ps01a_sRGB-03_complex_bkgnd.png
    6.1 MB · Views: 3
Hey, SouthernA, welcome to PSG.

The problem with working from the screen shot images that you posted is that their resolution is quite low, 626 x 285 pixels, and since there are vertical lines in the display that appear to be only 1 pixel wide, so I'm worried that after extraction and printing, the result will look pretty amateurish.

To be honest, if it was me, I would use a completely different program, Matlab, that could produce the same graph, except at much higher resolution, and with any background color you want. If you don't have access to Matlab, there is a free version called, "Octave" that you could use. If you don't want to go that route, I'm sure there are many other audio waveform viewing programs available that could produce better output than the screenshot that you posted.

HTH,

Tom M

Haha
I basically lost the war before it started using "prt sc", huh?

I'll most definitely look into Matlab/Octave. Thank you.
 
This is about the best I could do. I first used Photo Zoom 5 to up-rez it by 3x in each dimension. Then I used the color range tool to extract out the blue. Finally, for fun, I put several different backgrounds behind the extracted waveform. Note: The PNG labeled, "transparent bkgnd" will show as a white background when displayed in this forum, but if you download the file, the background will indeed be transparent, as you requested.

If the quality of these is not good enough, I think you won't have much choice except to use a different program to generate the waveform at higher resolution.

HTH,

Tom M

Man oh man, WHAT AN IMPROVEMENT! Just put the first image with the blank background into photoshop, looks a hundred times better/cleaner. Wow.

So after the audio is put into Octave/Matlab, how would I go about putting the image in Photo Zoom 5 outside of "prt sc", and up-rezzing it as well? Or is "prt sc" the only way to go?


As for options that would generate the waveform at a higher resolution, i'd definitely love to explore some and see what I could get out of it. Are there any you could recommend? I thought "Audacity" was my best bet for the longest haha.
 
Note: The OP sent me a private message asking for help with Matlab / Octave. Since we like to keep all tutorials available to the public, I said that I would reply in the thread. Here's my reply to him ...
--------------------------------

Hey, this is going to have to be short because we are going out of town visiting relatives for the day, but here's the general idea ...

1. Use your audio editor to produce a very short snippet of the music. To figure out how long it should be, let's assume you want to produce a picture that is 5000 pixels wide (ie, quite high resolution). Let's further assume that you want each sample to have it's own pixel. Therefore, at a sampling rate of, say, 44 KHz, ie, just under 50 kHz, to get 5000 samples, your snippet only needs to be about 0.1 second long.

2. Open Octave / Matlab and use the "audioread()" function to store the samples that are in this short audio file into a Matlab vector, as shown here:
http://www.mathworks.com/help/matlab/ref/audioread.html

3. Next, you need to plot the data. For this, you call Matlab's "plot()" function:
http://www.mathworks.com/help/matlab/ref/plot.html

4. The "plot()" function can be used in many, many different ways, but it always requires two arguments, for your use, the first, X, is simply a vector containing the sample numbers 1, 2, 3 ... etc.. Filling a vector with consecutive integers is one of the first exercises assigned to students learning Matlab. There are many tutorials on this. Google is your friend. ;-)

5. The second argument required by the plot() function is, Y, the vector of sample values. You already have this since you previously called audioread().

6. Before you do anything fancy with the plot() function (ie, like a transparent background), I suggest that you begin with a very simple plot, a black line graph on a plain white background. This is the default for the plot() function. Once you see something, experiment with the zillion options available in Matlab to get the graph to look just like what you had envisioned.

7. Once you see the graph of the part of the audio waveform that you want (ie, looks visually interesting, contains a continuous line of the right thickness, but without markers for each data point, is the right length, etc.), then you can consider exporting the graph as a PNG or a TIFF with transparency using the export_fig() function:
http://www.mathworks.com/matlabcentral/newsreader/view_thread/170398
http://www.mathworks.com/matlabcentral/fileexchange/23629-export-fig

The above procedure may look more complicated and time consuming than it really is, but the quality of the results and the flexibility it affords is stupendous.

Note: You asked about PhotoZoom. With the above procedure, since the output graph is already a PNG that is many thousand pixels wide and already has a transparent background, you don't need to use PhotoZoom, nor do you need to carefully select the background color and delete it. :-)

HTH,

Tom M
 
Tom you never cease to amaze me with your knowledge !!

.....Even if I have little idea about what your explaining ,,,Thanks!
 
Note: The OP sent me a private message asking for help with Matlab / Octave. Since we like to keep all tutorials available to the public, I said that I would reply in the thread. Here's my reply to him ...
--------------------------------

Hey, this is going to have to be short because we are going out of town visiting relatives for the day, but here's the general idea ...

1. Use your audio editor to produce a very short snippet of the music. To figure out how long it should be, let's assume you want to produce a picture that is 5000 pixels wide (ie, quite high resolution). Let's further assume that you want each sample to have it's own pixel. Therefore, at a sampling rate of, say, 44 KHz, ie, just under 50 kHz, to get 5000 samples, your snippet only needs to be about 0.1 second long.

2. Open Octave / Matlab and use the "audioread()" function to store the samples that are in this short audio file into a Matlab vector, as shown here:
http://www.mathworks.com/help/matlab/ref/audioread.html

3. Next, you need to plot the data. For this, you call Matlab's "plot()" function:
http://www.mathworks.com/help/matlab/ref/plot.html

4. The "plot()" function can be used in many, many different ways, but it always requires two arguments, for your use, the first, X, is simply a vector containing the sample numbers 1, 2, 3 ... etc.. Filling a vector with consecutive integers is one of the first exercises assigned to students learning Matlab. There are many tutorials on this. Google is your friend. ;-)

5. The second argument required by the plot() function is, Y, the vector of sample values. You already have this since you previously called audioread().

6. Before you do anything fancy with the plot() function (ie, like a transparent background), I suggest that you begin with a very simple plot, a black line graph on a plain white background. This is the default for the plot() function. Once you see something, experiment with the zillion options available in Matlab to get the graph to look just like what you had envisioned.

7. Once you see the graph of the part of the audio waveform that you want (ie, looks visually interesting, contains a continuous line of the right thickness, but without markers for each data point, is the right length, etc.), then you can consider exporting the graph as a PNG or a TIFF with transparency using the export_fig() function:
http://www.mathworks.com/matlabcentral/newsreader/view_thread/170398
http://www.mathworks.com/matlabcentral/fileexchange/23629-export-fig

The above procedure may look more complicated and time consuming than it really is, but the quality of the results and the flexibility it affords is stupendous.

Note: You asked about PhotoZoom. With the above procedure, since the output graph is already a PNG that is many thousand pixels wide and already has a transparent background, you don't need to use PhotoZoom, nor do you need to carefully select the background color and delete it. :-)

HTH,

Tom M

Tom, I am EXTREMELY lost. Clearly coding (if this is even coding) is not my thing. I've been fiddling around with Octave since yesterday and I have no clue what i'm doing or how in the world I go from the text in this black window to an image of a waveform.

I've been up and down the mathworks website as well, it's like reading a foreign language haha.
 
@Southern Auggie
The image is going on a T-shirt..right? Is it on the shirt as stand alone or is it part of another element of the design? T-shirt sizing would need it to be 10-12" . I know nothing about what Professor Mann has said above but I know a bit about printing shirts and I do color separations for screen printers. My thought is that the music image should be vectorized and then sized to where it needs to be. Can you put another image here and I will see what I can do for you.

Yes, It's going to essentially look like this. audio.png

A few different waveforms with a bit of text here and there. Nothing too crazy.

I make the design (such as this) over a stock google t-shirt. When I have it the way I like, I remove the layer with the t-shirt so just the design is left, upload it to a t-shirt printing website (uberprints, spreadshirt, vistaprint etc.), order it and get it made.

Note: the waveforms will be white in the final design for sure.
 
Yes, It's going to essentially look like this. View attachment 51839

A few different waveforms with a bit of text here and there. Nothing too crazy.

I make the design (such as this) over a stock google t-shirt. When I have it the way I like, I remove the layer with the t-shirt so just the design is left, upload it to a t-shirt printing website (uberprints, spreadshirt, vistaprint etc.), order it and get it made.

Note: the waveforms will be white in the final design for sure.

OK, I am quite sure that the sites your submitting to are using DTG printing (Direct to Garment) for which the preparation is somewhat different than for screening. However, you need the best quality you can get. Tell me, have you been getting away with the screen shot in the past? Most printers like 300ppi as a minimum or is this your first design like this and hoping to sell these?
So, you would actually have more than one waveform on the design, thus your need to process these more efficiently..correct? Tom has given you good information I'm sure but apparently your running into some difficulty in the execution of his procedure if I read correctly. I, can take the screenshot image and manipulate it by using enlargement software etc and then trace it in Ai to make it into a vector file but do you have that capability to do something like I am describing? If it's just going to be the same design, over and over, then one file that I can make for you would serve.
If this is going to be an ongoing process, then you would need to develop a process that works for you. Let me know what software you have and your experience level using it.

Edit: PS-what Tom Mann has given you is perfect if you can get it to work for you.
 
Last edited:
OK, I am quite sure that the sites your submitting to are using DTG printing (Direct to Garment) for which the preparation is somewhat different than for screening. However, you need the best quality you can get. Tell me, have you been getting away with the screen shot in the past? Most printers like 300ppi as a minimum or is this your first design like this and hoping to sell these?
So, you would actually have more than one waveform on the design, thus your need to process these more efficiently..correct? Tom has given you good information I'm sure but apparently your running into some difficulty in the execution of his procedure if I read correctly. I, can take the screenshot image and manipulate it by using enlargement software etc and then trace it in Ai to make it into a vector file but do you have that capability to do something like I am describing? If it's just going to be the same design, over and over, then one file that I can make for you would serve.
If this is going to be an ongoing process, then you would need to develop a process that works for you. Let me know what software you have and your experience level using it.

Edit: PS-what Tom Mann has given you is perfect if you can get it to work for you.

As for the screenshots, i've never made a shirt using this method.The last shirt I made was strictly text/shapes, and that's what I tend to stick to. Dealing with screenshots, waves, and other programs etc. is completely new territory for me.

Here are the 4 waveforms I've decided to play around with:
BOBMARLEY-SHOT.png
JOHN-F-KENNEDY-SHIRT.png
NINASIMONE-SHIRT.png
SHAKUR---SHIRT.png

I can also provide the raw mp3 files if those are necessary as well. And I also have 2 other audio programs to put them in if these don't work.
 
Replied to your PM.
 
Hey guys, I'm back.
MikeMc - Thanks for the kind words, Mike, but it looks like it didn't help the OP as much as I had hoped. :redface:

@SouthernA -

I'm sorry that the outline of the Matlab procedure that I provided didn't work out for you.

At this point, I think we need to mentally zoom out a bit, kinda along the lines of thought that Larry has been pursuing. So, let's start with a question very similar to his:

1. "...are you hoping to sell these? ..."

2. If you do intend to sell these, is the reason you want to show specific sound files because you want to make several (...or even many) different shirts available, eg, a "Stairway to Heaven" shirt, an "Allman Brothers Jessica" shirt, etc.?

3. If you don't need the waveforms corresponding to specific music tracks, and a few generic waveforms would be OK, why didn't you just search Google Images for {audio waveform} and set the desired resolution to be something large, like "Greater than 2 Mpixels"? When I did such a search, it produced dozens of hits, most of which seemed almost immediately useful. Of course, don't forget that there are many, many different, equally valid ways to visualize the data in a sound file starting with a simple adjustment like the time scale you are using. A snipped that is a couple of seconds long will look wildly different from a snippet that is only, say, 10 msec long (eg, that one might use if you are looking for zero crossings to make a click-less loop). Many different variants show up in the Google Image search.

4. If you do want to continue to pursue producing your own audio waveforms at high resolution using Matlab, Googling {matlab plot audio file} turned up numerous tutorials that give the specific lines of Matlab statements you would need. At most about a dozen lines of Matlab code is all that you might ever need, and it can certainly be done in as few as four lines of code, e.g.
http://www.edaboard.com/thread204960.html - ie, the first four lines of code in post #2 in that thread.
http://stackoverflow.com/questions/5200179/plotting-a-sound-signal - the 5 lines of code in posts #1 and #2 in that thread.
http://www.mathworks.com/matlabcentral/answers/22112-how-to-plot-wav-file - the first 6 lines of code in the first response in that thread. Add the 7th line if you want to display a spectrogram of that bit of audio.

5. Let me close by re-asking / quoting another of Larry's very appropriate questions: "...If this is going to be an ongoing process, then you would need to develop a process that works for you. Let me know what software you have and your experience level using it....".

Cheers,

Tom M
 
Hey guys, I'm back.
@MikeMc - Thanks for the kind words, Mike, but it looks like it didn't help the OP as much as I had hoped. :redface:

@SouthernA -

I'm sorry that the outline of the Matlab procedure that I provided didn't work out for you.

At this point, I think we need to mentally zoom out a bit, kinda along the lines of thought that Larry has been pursuing. So, let's start with a question very similar to his:

1. "...are you hoping to sell these? ..."

2. If you do intend to sell these, is the reason you want to show specific sound files because you want to make several (...or even many) different shirts available, eg, a "Stairway to Heaven" shirt, an "Allman Brothers Jessica" shirt, etc.?

3. If you don't need the waveforms corresponding to specific music tracks, and a few generic waveforms would be OK, why didn't you just search Google Images for {audio waveform} and set the desired resolution to be something large, like "Greater than 2 Mpixels"? When I did such a search, it produced dozens of hits, most of which seemed almost immediately useful. Of course, don't forget that there are many, many different, equally valid ways to visualize the data in a sound file starting with a simple adjustment like the time scale you are using. A snipped that is a couple of seconds long will look wildly different from a snippet that is only, say, 10 msec long (eg, that one might use if you are looking for zero crossings to make a click-less loop). Many different variants show up in the Google Image search.

4. If you do want to continue to pursue producing your own audio waveforms at high resolution using Matlab, Googling {matlab plot audio file} turned up numerous tutorials that give the specific lines of Matlab statements you would need. At most about a dozen lines of Matlab code is all that you might ever need, and it can certainly be done in as few as four lines of code, e.g.
http://www.edaboard.com/thread204960.html - ie, the first four lines of code in post #2 in that thread.
http://stackoverflow.com/questions/5200179/plotting-a-sound-signal - the 5 lines of code in posts #1 and #2 in that thread.
http://www.mathworks.com/matlabcentral/answers/22112-how-to-plot-wav-file - the first 6 lines of code in the first response in that thread. Add the 7th line if you want to display a spectrogram of that bit of audio.

5. Let me close by re-asking / quoting another of Larry's very appropriate questions: "...If this is going to be an ongoing process, then you would need to develop a process that works for you. Let me know what software you have and your experience level using it....".

Cheers,

Tom M

1. Yes! They will be on sale. There's a specific message behind the audio that will be visually displayed on the shirt, that's the reason i've been so headstrong.

2. No luck. As soon as I enter the first line of code, I press enter, it gives me an error, and the whole program closes. I'm new to coding and all of that jazz, so forgive me if I ask anything completely left field: but is it possible that my computer is the problem? Or I have a bad version of the program?

After this batch of shirts are made I don't really have plans creating a similar design involving waveforms. My main focus is putting together this design by tomorrow night -- that's when I plan to place my order.
 
@SouthernA - Thank you for being honest about the commercial use of these images.

Every participant in this forum has their own opinion on helping entrepreneurs and is free to do what they feel most appropriate.

My personal opinion (ie, not speaking as a moderator) is that I will bend over backwards to help someone learn Photoshop related skills and techniques. Occasionally, if there is a family emergency situation (eg, rescuing photos that have been damaged by fire or flood, helping someone quickly prepare photos for a funeral, charitable causes, etc.), I will do work at no charge for individuals in such situations. However, I draw the line at doing free work for someone who themselves will likely make money off of my work.

So, if you you would like to continue to learn the techniques you need to get to your goal, I'll be more than happy to help you learn them. However, I won't supply another good quality, un-watermarked image for you to use.

That being said, there are participants in this forum who are only too happy to do free work for others, be it out of the goodness of their heart, for practice, to build their portfolios, or for reasons only known to themselves. You may have to have to wait for someone like this to come along, but it happens all the time.

Another option for you is to place a request for help on our fee-for-service forum and negotiate a fee with the folks who respond. Be sure to read the sticky threads at the top of that forum and abide by the rules PSG has laid down. People are likely to respond to a notice of a paying job on that forum much more quickly, and there is a good chance that the work will be of higher quality than a freebie.

Good luck with your enterprise.

Tom M

PS - If you decide to go with the fee-for-service route, to give others a chance, I will not bid on your job.
 
Last edited:

Back
Top